Mistakes suck.
Errors are painful. But, acknowledging mistakes is essential for identifying what not to repeat, it helps us identify how to improve.
As someone who makes about eleven mistakes a day, many noteworthy, I have honed an ability to not become defensive when I uncover another blunder. Thus, about 18 months ago, I decided to dip my toes into the turbulent waters of the replication wars by turning the mirror onto myself, asking whether I made mistakes, asking whether I contributed to the puffs of smoke polluting our field.
I decided to check myself, in the hopes of not wrecking myself. What I discovered about myself was not pleasant. It hurt to learn that my early papers were dominated by findings that did not appear robust; it was upsetting to think that my early work stood a decent chance of not replicating. To publicly admit my past shortcomings was scary. I hesitated for a long time before sending my first analysis off. I seriously wondered whether my job would be in jeopardy.
There was also good news in my first self-analysis: my work had shown measurable signs of improvement. In contrast to my first 10 empirical papers, when I analyzed what were then my last 10 papers (published in 2014-2015), I discovered a more solid appearing set of studies. Though I suspect there were still puffs of smoke in there, I was trending in the right direction. By facing our problems head-on, by listening to our fields’ critics, I took small incremental steps to improve my research practices, and it appeared I was getting better.
Was it just a fluke?
Was my research really improving or did I simply stumble upon a more robust set of studies that happened to come later in time? What would happen if I checked myself again? I decided to find out.
The method I used was identical to what I used the first time I checked myself. I examined my most recent ten empirical papers (2015-present), examining the one statistic per study that corresponded to the main hypothesis of interest. This was often some form of interaction, but it was sometimes a main effect. Because each typical study contains multiple statistics, often testing various parts of the main hypothesis, it was not always easy to pick which statistic to include. As a rule, I decided to select the first relevant statistic to appear in the paper and I tried my best to be fair. However, there are so many statistics in a typical paper that bear on the main hypothesis, there are so many degrees of freedom here, that it would be completely unsurprising if different people came up with somewhat different results. Nonetheless, I tried my best to be unbiased.
I then entered all of these statistics into the p-checker app and the p-curve app. If you haven’t seen these apps, do yourself a favour and check them out. They are now indispensable tools for when I review and edit papers. These online apps return a number of indices of scientific quality, assessing the extent to which a set of papers are replicable: the p-curve, which can assess the evidential value of a number of findings; the Replicability-Index (R-index), which is thought to track the replicability of findings; and the Test for Insufficient Variance (TIVA), which can be used to detect whether questionable research practices might have influenced a body of results. You can see the results of my last 10 papers below*; you can also re-create them on p-checker here.
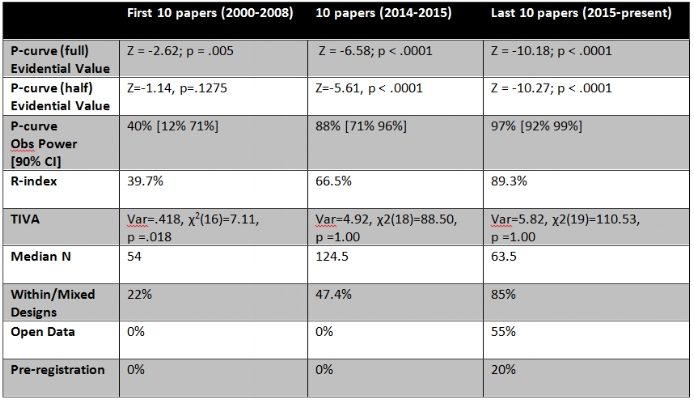
My last ten papers look good. I have no doubt that I am still making mistakes; I am still worried about emitting puffs of smoke (!), but these numbers are a legitimate source of optimism. They suggest that I am continuing to improve.
I’d like to highlight a few things. The fine folks behind the p-curve, have recently updated their metric (p-curve 4.0) with a combination test, examining a combination of what they call a full and a half p-curve, that is now more robust to ambitious p-hacking than the simple full p-curve test is; it is only when both tests check-out that evidential value can be proclaimed. Unlike the first time I checked myself, this combination p-curve (which failed to reveal evidential value with the half test) suggested the evidential value of my first ten papers was lacking, bringing it in line with what my original R-index and TIVA revealed. The good news is that this combination test continued to suggest my middle ten papers (2014-2015) had evidential value. More important, my last ten papers passed the evidential value hurdle with ease. Both the R-index and TIVA retuned similar results, failing to flag my papers as being the product of questionable research practices and suggesting the papers were replicable.
Second, while the median sample size of my studies looks to have regressed, we should be careful not to conflate sample size with statistical power. Yes, my sample sizes have decreased from 2014-2015, but the designs I use changed quite a bit: 85% of my latest papers used either a completely within or a mixed design, and these usually carry sizable power advantages. Indeed, p-curve estimates of observed power suggest my last ten papers achieved 97% power**, an increase from my middle ten papers despite the latter using much larger samples on average.
Third, I am beginning to practice open science. Over half of my most recent publications are based on data (and with methods) that are open and publicly posted. To be clear, I have always shared my data when asked by researchers, but now researchers don’t need to ask me to get access to my data; they can find my data linked directly in the papers themselves or on my website. I have also experimented with pre-registration, with us pre-committing to more and more of my work. Almost every single experiment we run these days is pre-registered in one form or another. For me, the best part of pre-registration is not what it signals to others, but the fact that it keeps us honest with ourselves; it reminds us what we thought our data would look like before actually seeing it.
Some of you might be asking why I’m bothering to do this. In the parlance of our time, some of you might be wondering if I am speaking in a braggadocious manner, showing off. If I am coming off this way, dear readers, please allow me this. In the past few months, I’ve revealed some skeletons in my closet, wallowed in self-pity, had “fuck” associated with my name multiple times, and divulged how I lost faith. So, please allow me this brief moment of pride.
This post, however, is meant to be more than an ego-stroke. Just as we periodically visit the dentist for our twice-annual check-up to identify and correct signs of tooth decay, we should check our results regularly to identify and correct for signs of low-replicability. My analysis suggests I am getting better, but I need to keep trying to improve and to keep checking myself.
This exercise suggests I am practicing good science hygiene. I conduct power analysis for all my studies; I pre-register my hypotheses; I try to use rich, typically repeated, dependent variables; I post my data and materials; I have committed to start using stat-check before submitting new manuscripts. Most critically, perhaps, I think very differently about experimental design. While my first papers were characterized by the wide use of 2x2 between-subject (BS) designs, not one of my last 10 papers includes such BS. Instead, I have increasingly used within-subject designs, which sometimes makes my life harder—for example, bringing in participants to the lab twice—but also increases statistical power. Finally, I have also been paying attention to the conversation about replication, trying to learn as much as I can from people far smarter than I.
To be clear, replicability is not the only thing that concerns me. I agree that good science is multiply-determined, and characterized by things like discovery, internal and external validity, creativity, cumulativeness, etc. However, I believe replicability takes priority over, even constrains, these other concerns. In my experience, I have not experienced tradeoffs—I don’t think my science is less creative or less concerned with internal or external validity because of my new stress on replicability. Perhaps the only thing that has changed is I am taking things slower; and this will eventually mean fewer publications. I see this as a net positive for all concerned, especially my readers.
I hope my self-examination here will encourage other researchers to check themselves, even publicly. I especially encourage senior researchers, researchers with tenure, to engage in this exercise. Such researchers might be surprised and disappointed by what they learn; so disappointed that they might be spurred to start flossing, to start practicing better science hygiene themselves.
And if researchers like what they see, if they are proud of the results of their own check-up, I think they have earned a right to show off. At least for a time.
----------------------------------------------
* Because of a change in the way p-checker calculates the R-index and TIVA (due to an error being corrected), the numbers from my middle 10 papers do not correspond to the numbers I initially reported.
** Observed (or post-hoc) power is a controversial topic, which some claims that observed power has no association with actual power. In the aggregate, however, observed power provides an unbiased estimate of actual power, assuming enough studies are aggregated.